Measure the Effectiveness of Artifact Cache
Read how much dependency download volume your builds avoid by resolving from a cache, attribute that volume to Develocity Artifact Cache specifically, and find the projects it helps least.
Prerequisites
-
Develocity 2026.1 or later
-
Develocity Gradle plugin 4.4.0 or later, or Develocity Maven extension 2.4.0 or later
-
The Common Custom User Data Gradle plugin 2.1.0 or later, or the Common Custom User Data Maven extension
-
A Develocity Reporting Kit deployment with dashboard bundle 2.2 or later
Read Cache Savings Across All Builds
The "Dependency Caching" dashboard reports what share of dependency files your builds resolved from a cache rather than downloading, across all projects and builds. It covers Gradle and Maven builds running locally and on CI, and detects cached files whatever caching solution served them.
-
Open the "Dependency Caching" dashboard in Develocity Reporting and Visualization, and set the relevant filters to inspect the builds you are most interested in.
-
When using Develocity 2026.3 or later and dashboard bundle 2.4 or later, set the Cache filter to Develocity Artifact Cache. This filter applies per artifact, so the panels below report the volume Artifact Cache itself served. For older component versions, apply the ARTIFACT_CACHE tag filter, added to your builds by the Common Custom User Data Gradle plugin or Maven extension. The tag filter applies per build, so it selects the builds that had Artifact Cache or Setup Cache enabled and credits every cache those builds used, not Artifact Cache alone.
 Select builds with Artifact Cache enabled
-
Reading: The Cache filter reads Develocity Artifact Cache and Tag(s) reads CI, so the panels below cover CI builds only.
-
-
The top-level panels report the overall volume of dependencies served by Artifact Cache compared to remote repositories in matching builds. The "Total cached" panel reports the number of dependency files served from the cache, while the "Total cached size" panel reports the total size of those cached files.
 Cache effectiveness across all matching builds
-
Reading: Across 5 projects the cache served 374 K files and 819 GiB, against 52.1 K files and 13.1 GiB downloaded, resulting in an overall cached size rate of 98.4%.
-
-
Scroll down to the details tables to inspect the cached rate and cached size rate aggregated at various levels, such as by project or requested tasks/goals. The "Details per project" table helps you identify which projects benefit the least from the cache. Next, drill down into a single build for the project you pick to understand why it is not benefiting from the cache.
 Cache effectiveness per project, for a CI-only Gradle fleet
-
Reading: Cached rate runs from 97.2% on
coffee-housedown to 0.0% ontemplates-lib. The two lowest-rate projects are the ones to inspect next.
-
Find What One Build Still Downloads
A project can have a low cached rate for several reasons: frequent changes to its dependencies, a misconfigured cache setup, or artifacts that cannot be cached. To diagnose what exactly the build downloads repeatedly and why, move from the cross-build view to a single build.
-
Open one Build Scan from a project at the bottom of the ranking.
-
Read the Artifact Cache values the Common Custom User Data plugin adds to every Build Scan as Custom Values, which report the configuration and the restore phase metrics for that build.
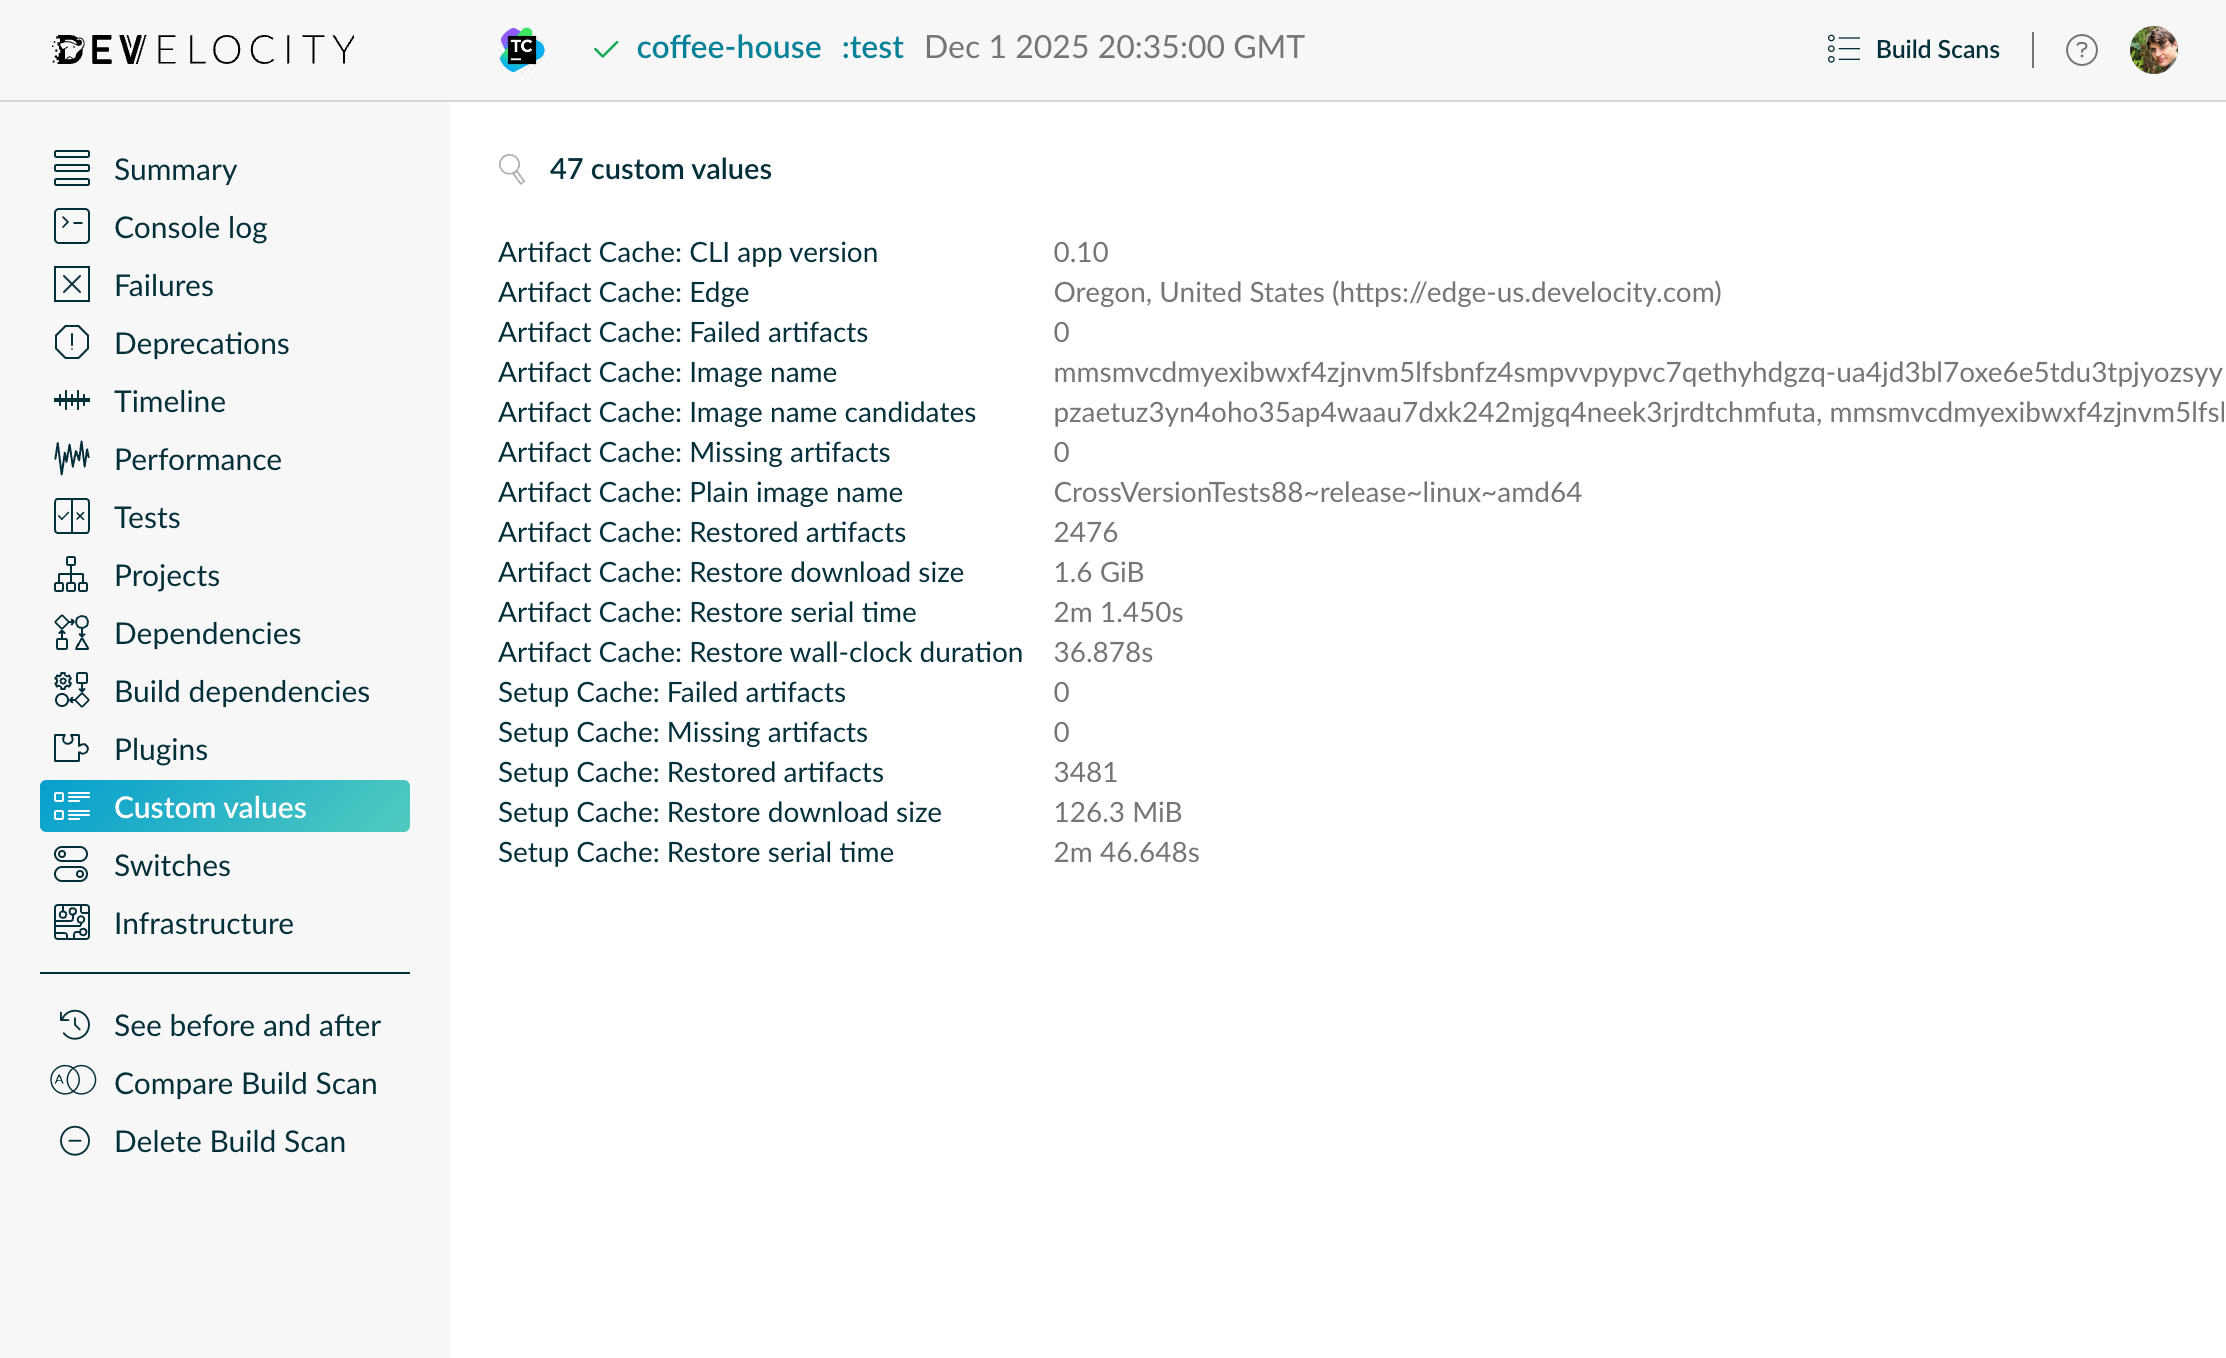 Artifact Cache details for a single build
-
Reading: This build restored 2476 artifacts and 1.6 GiB, with "Failed artifacts" and "Missing artifacts" both at 0. This means that the Artifact Cache retrieved every artifact it expected to serve for that build.
-
Non-zero "Failed artifacts" indicate that some artifacts that the Artifact Cache expected to serve were not successfully retrieved and had to be downloaded from the original source during the build. This negatively impacts the overall cache effectiveness for that build. Artifact retrieval failures are commonly caused by sporadic network issues or misconfigurations in the cache setup. Consult the Artifact Cache CLI logs to identify the root cause of the retrieval failures.
-
Similarly, "Missing artifacts" indicate that artifacts it expected to serve were no longer available in the cache. This is usually caused by the eviction of artifacts from the cache due to space constraints or cache policy rules. Consider updating your Edge storage configuration to accommodate your Artifact Cache usage pattern.
-
-
Even though the Artifact Cache retrieved every artifact it expected to serve for that build, the build may still resolve some dependencies from the original source, such as newly added or updated dependencies that have not yet been cached. To check, navigate to the "Network activity" tab of the "Performance" section and inspect the repository requests the build made. The list covers every request to a repository, including the metadata requests a resolution makes, so it holds more entries than the build downloaded artifacts.
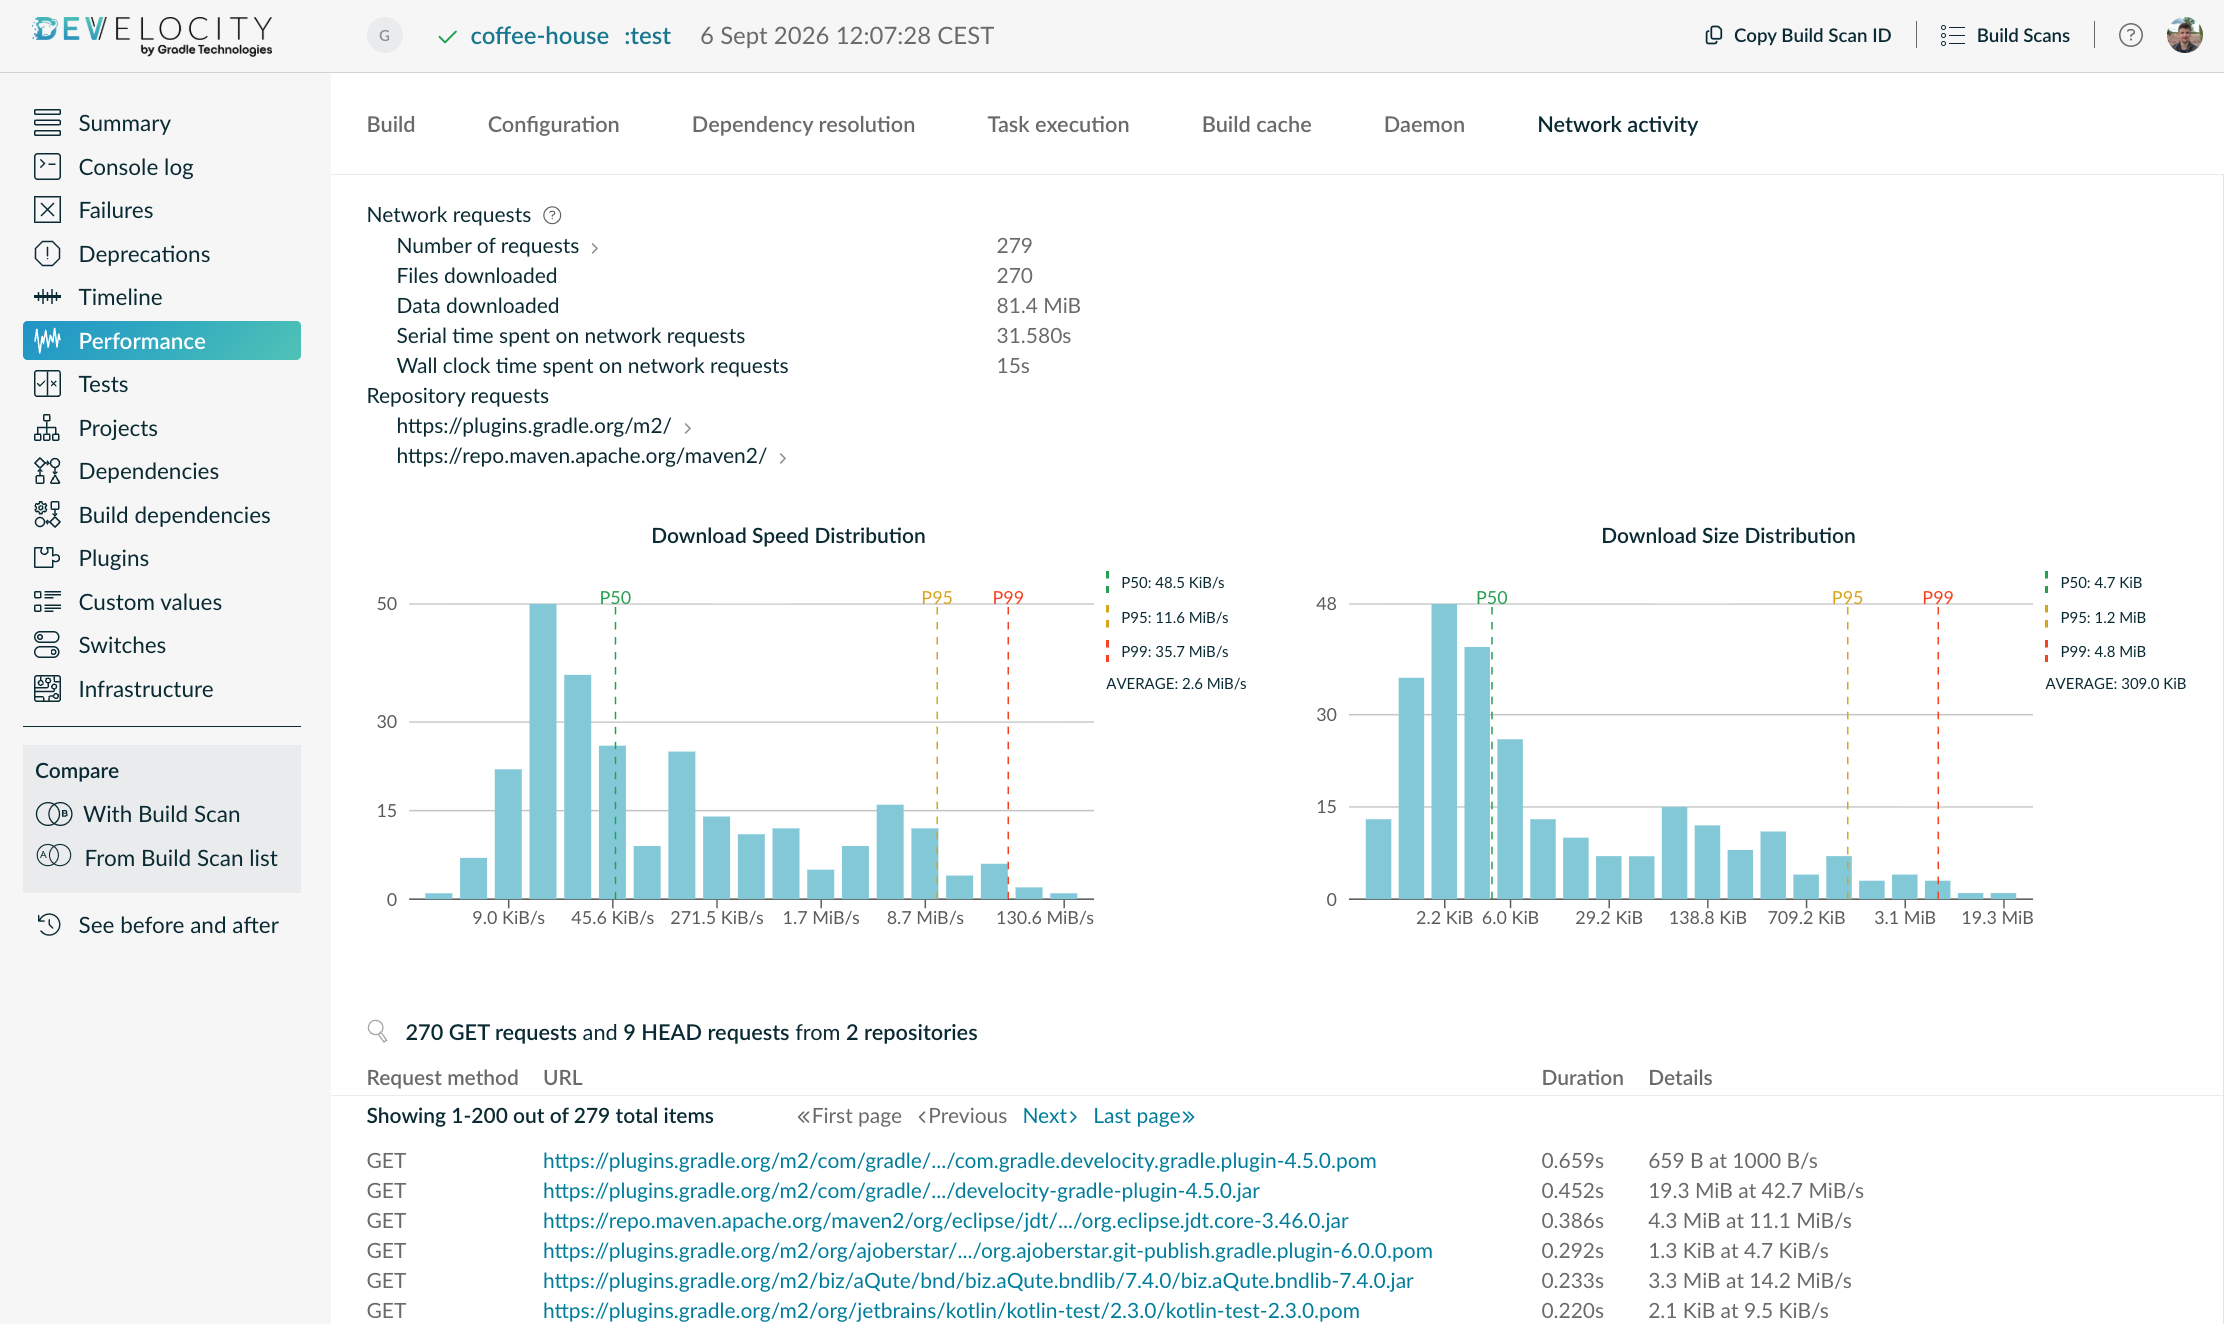 Network activity for a single build
-
Reading: This build made 279 repository requests, 270 GET and 9 HEAD, across 2 repositories for 81.4 MiB.
-
Next Steps
-
Ask the same question through an AI client. The Develocity Analytics MCP Server reads the same dependency caching data, including the per-cache breakdown the Cache filter applies, so a prompt such as What was the Artifact Cache hit rate per project over the last 30 days? returns the ranking without opening a dashboard.
-
Create custom reports by programmatically accessing the dependency caching statistics via the
gradle-dependency-cachingandmaven-dependency-cachingDevelocity APIs. -
Reduce what the remaining downloads cost you by working through Reduce the Impact of Repository Instabilities.
-
Check what served a specific dependency with Trace the Origin of a Dependency.