Installing the Dashboard Bundle for the Reporting Kit
The Reporting Kit variant of the dashboard bundle contains Grafana dashboard definitions that query build data through the Reporting Kit’s Trino endpoint, for use in a Grafana instance you manage yourself.
You only need this bundle if you run your own Grafana instance. The Reporting Kit includes a bundled Grafana instance that already contains these dashboards, and no import is required for it.
Contact your technical contact at Gradle for assistance integrating the dashboards into your on-premises or cloud Grafana instance.
Prerequisites
Before importing the dashboards, you need:
-
A running Reporting Kit installation, as described in the Develocity Reporting Kit Installation Manual.
-
Query access from your Grafana instance to the Reporting Kit’s Trino endpoint, enabled as described in Visualizing Data From a User-Managed Grafana Instance.
-
A downloaded and unzipped bundle from Downloads.
| Throughout the following steps, all shell commands are expected to run in the root directory of the extracted bundle. |
The bundle includes an example-datasource.yaml file, an example Grafana data source configuration you can import to set up the Trino data source.
It declares a trino-datasource named Develocity Reporting Kit Trino, and you specify your Reporting Kit’s URL, Trino credentials, and TLS material.
The dashboard JSON files reference the Trino data source by a fixed UID, develocity-reporting-kit-trino, which is the UID that example-datasource.yaml declares.
If you create the data source from that file, the dashboards work without modification.
Otherwise, insert the UID of your Trino data source into the dashboard JSON files.
The following command inserts the UID into all JSON files at once:
find ./dashboards -type f -name '*.json' -exec sed -i.bak 's/develocity-reporting-kit-trino/YOUR-DATASOURCE-UID/g' {} \; \
&& find ./dashboards -type f -name '*.json.bak' -exec rm {} \;|
You can find your data source’s UID in the Grafana UI by navigating to Connections → Data Sources and clicking the Trino data source. The UID is displayed in the URL. 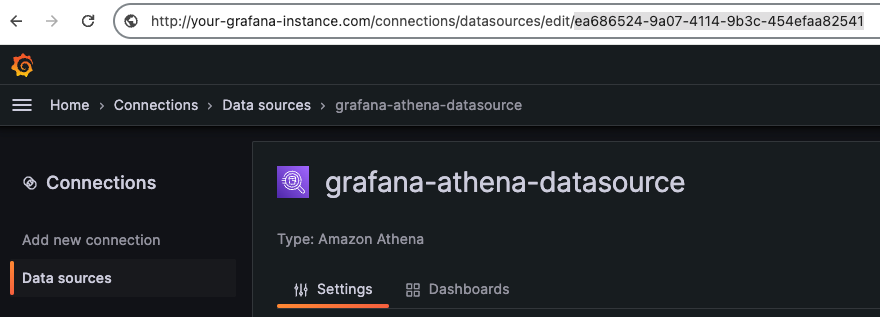
Example of Showing the Data Source’s UID in Grafana
|
Compatibility
For the Grafana versions the dashboards are tested against, see Grafana dashboard compatibility.
This variant always carries the same version as the Reporting Kit it ships alongside. See User-Managed Grafana Dashboard Bundle.
For the minimum Develocity version each dashboard needs to be populated, see Develocity Reporting Kit compatibility.
Most of the Gradle-provided dashboards rely on specific tags and custom values being present on Build Scan records to render the intended visualizations.
Tags used within the dashboards:
-
CI: classifies builds as either CI builds (the tag is present) or local builds (the tag is absent)
Custom values used within the dashboards:
-
Git repository: the URI of the Git repository the build ran in, for example[email protected]:gradle/gradle.git -
CI provider: the name of the CI provider that ran the build, for exampleGitHub Actions
|
If you use the Common Custom User Data Gradle plugin or the Common Custom User Data Maven extension, this information is added to every Build Scan automatically. |
Installation Methods
The steps for importing the dashboards differ depending on the type of Grafana installation. Besides manual import and the built-in provisioning mechanism, Grafana also offers a variety of infrastructure as code options for managing dashboards, and a dashboard HTTP API.
Using the Built-in Grafana Provisioning Mechanism
Use if you have access to the file system of the Grafana server.
Grafana has a provisioning mechanism that lets you point it at a directory containing dashboard definitions in JSON format. Grafana watches that directory for changes and automatically imports new dashboards or updates existing ones.
Steps:
-
Replace the data source UID in the dashboard files with the UID of your Trino data source, as described in Prerequisites.
-
Copy the contents of the
dashboardsfolder from the bundle into a directory on your Grafana server. This guide assumes you copied the contents into/var/lib/grafana/dashboards, so that you end up with the following directory structure:/var/lib/grafana/dashboards/ ├─ 00 - Overview/ │ ├─ global-volume.json │ ├─ project-volume.json ├─ 10 - Environment/ │ ├─ build-tools.json │ ├─ ... ├─ ... -
Place a
dashboards.yamlfile with the following content into Grafana’s provisioning directory at/etc/grafana/provisioning/dashboards/.apiVersion: 1 providers: - name: 'Gradle Develocity Dashboards' type: file allowUiUpdates: false disableDeletion: true updateIntervalSeconds: 60 options: path: /var/lib/grafana/dashboards foldersFromFilesStructure: true
Using Grafana Provisioning With Helm and Kubernetes
Use if you are self-hosting Grafana in a Kubernetes cluster and you manage your Grafana deployment with Helm.
The Grafana Helm chart contains an option that allows Grafana to discover and collect dashboards stored in ConfigMaps within the cluster.
Steps:
-
Replace the data source UID in the dashboard files with the UID of your Trino data source, as described in Prerequisites.
-
Place the dashboards into ConfigMaps with the label
grafana_dashboard: "1". Grafana recommends creating one ConfigMap per dashboard. You can create ConfigMaps individually per dashboard using the followingkubectlcommand:kubectl create configmap overview-global-volume-dashboard \ -n <YOUR-NAMESPACE> \ --from-file='./dashboards/00 - Overview/global-volume.json' \ --dry-run=client \ -o yaml \ | kubectl label -f- --dry-run=client -o yaml --local grafana_dashboard=1 \ | kubectl annotate -f- --dry-run=client -o yaml --local 'grafana_folder=/tmp/dashboards/00 - Overview' \ | kubectl apply --server-side=true -f -To help you import all the dashboards while preserving the recommended folder structure, a kustomize file is included in the bundle. Apply it with this command:
kubectl kustomize ./ | kubectl apply -n <YOUR-NAMESPACE> --server-side=true -f - -
Enable and configure the
dashboardssidecar container in Grafana’svalues.yamlfile:sidecar: dashboards: enabled: true label: grafana_dashboard label_value: '1' folderAnnotation: grafana_folder provider: name: 'Gradle Develocity Dashboards' type: file allowUiUpdates: false disableDeletion: true foldersFromFilesStructure: trueFor more information, refer to Grafana’s Helm installation guide and the Helm chart documentation.
Manually Importing Dashboards via the Grafana UI
Use if you only need a small subset of the provided dashboards, and you can’t use any of the more automated methods described above.
You need the Editor role in Grafana to import dashboards via the UI.
|
Steps:
-
Replace the data source UID in the dashboard files with the UID of your Trino data source, as described in Prerequisites.
-
Go to your Grafana’s dashboard view at
https://grafana.example.com/dashboards. -
Optional: create a new folder for the Gradle dashboards by clicking New and selecting Create Folder.
-
Click New and select Import.
-
Drag the JSON file of the dashboard you want to import into the drop zone, or click the drop zone to open a file dialog, then click Load.
-
Confirm the name of the dashboard and the folder you want to import it into, then click Import.
Upgrading
When you upgrade the Reporting Kit, new data becomes available and new dashboards may be added to surface more insights.
|
Upgrading replaces every Gradle-provided dashboard. If you have created your own dashboards, or imported the bundle into a Grafana instance that holds other dashboards, make sure you only remove the dashboards supplied by Gradle. |
How you deploy the new set of dashboards depends on how you originally installed them, so follow the instructions for your Grafana installation type.
Upgrading Dashboards Provisioned With the Built-in Mechanism
If you installed the dashboards as described in Using the Built-in Grafana Provisioning Mechanism, upgrade them as follows:
-
Open your Grafana provisioning folder.
-
Delete all folders and files you want to update within the folder.
In a Docker Desktop environment, this may cause Docker to stop syncing changes. If that happens, restart the container, delete the files one by one, or enable File Sharing in your Docker Desktop settings.
-
Open Grafana and log in with an account that has edit privileges.
-
Open the Dashboards view and select the checkbox next to the Name header to select all folders.
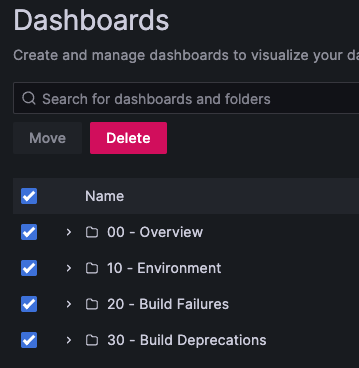 Example of Selecting All Dashboard Folders by Name
 -
Click Delete. This removes all dangling folders from the Grafana UI that can’t be automatically unprovisioned.
-
Download the latest bundle from Downloads.
-
Replace the data source UID in the dashboard files with the UID of your Trino data source, as described in Prerequisites.
-
Copy the contents of the
dashboardsfolder from the bundle into a directory on your Grafana server. -
Restart your Grafana instance to apply the changes.
Upgrading Dashboards Provisioned With Helm and Kubernetes
If you installed the dashboards as described in Using Grafana Provisioning With Helm and Kubernetes, upgrade them as follows:
-
Delete the ConfigMaps containing the dashboards.
kubectl --namespace <YOUR-NAMESPACE> delete configmap -l grafana_dashboard=1 -
Open Grafana and log in with an account that has edit privileges.
-
Open the Dashboards view and select the checkbox next to the Name header to select all folders.
Example of Selecting All Dashboard Folders by Name -
Click Delete.
-
Download the latest bundle from Downloads.
-
Replace the data source UID in the dashboard files with the UID of your Trino data source, as described in Prerequisites.
-
Run the kustomize file included in the bundle to re-import the dashboards.
kubectl kustomize ./ | kubectl apply -n <YOUR-NAMESPACE> --server-side=true -f -
Upgrading Manually Imported Dashboards
If you imported the dashboards as described in Manually Importing Dashboards via the Grafana UI, upgrade them as follows:
-
Open Grafana and log in with an account that has edit privileges.
-
Open the Dashboards view and select the checkbox next to the Name header to select all folders.
Example of Selecting All Dashboard Folders by Name -
Click Delete.
-
Download the latest bundle from Downloads and follow the installation procedure again.