Getting Started With Develocity for Bazel
Installation
Develocity server installation is not covered here. Consult one of the following installation manuals for help with installation:
The examples in this guide use develocity.example.com as the Develocity hostname with HTTPS enabled.
Quickstart Project
If you do not have a suitable Bazel project to try Develocity with, use the Bazel Develocity quickstart project.
Build Scan
A Build Scan is a permanent, shareable record of a Bazel invocation, capturing console output, test results, a build timeline, and performance data.
Configuring Bazel
Follow the instructions in the Configuration Guide to modify your project’s .bazelrc file.
At a minimum, an unauthenticated Build Scan requires the following configuration in your .bazelrc file:
common:develocity --remote_cache=grpcs://develocity.example.com
common:develocity --bes_results_url=https://develocity.example.com/build/
common:develocity --bes_backend=grpcs://develocity.example.com

build --config=develocity
As the build completes, the last lines of the output will be similar to:
INFO: Streaming build results to: https://develocity.example.com/build/f26e14c5-dfab-4725-8a77-648f4f8a0ff9
The last portion of the URL is the Bazel invocation ID. Follow that link to view your Build Scan.
Additional configuration for authentication, remote cache, and project names is covered in the Configuration Guide.
Find and View Any Build Scan
Search through all captured Build Scan records by going to https://develocity.example.com/scans.
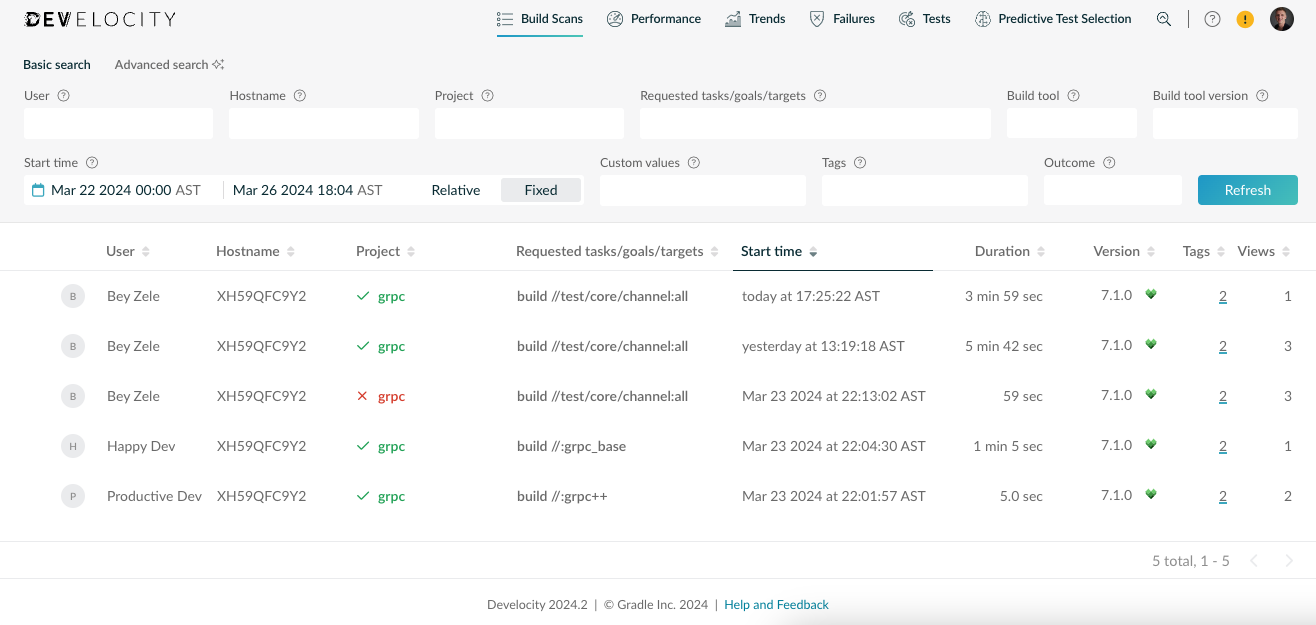
Search by project name, username, build outcome, start time, and more. By default, the list shows the most recent scans first.
The listing can also surface insights you did not know to look for:
-
Recurring failures across your organization’s builds
-
Builds taking longer than expected in certain cases
-
Users running more commands than necessary, adding avoidable build time
Share Console Logs
The Build Scan includes the console output produced by the build. Many tools used by the build, such as compilers, often write diagnostic information to the console log.
Use the left navigation menu to visit the Console log section.
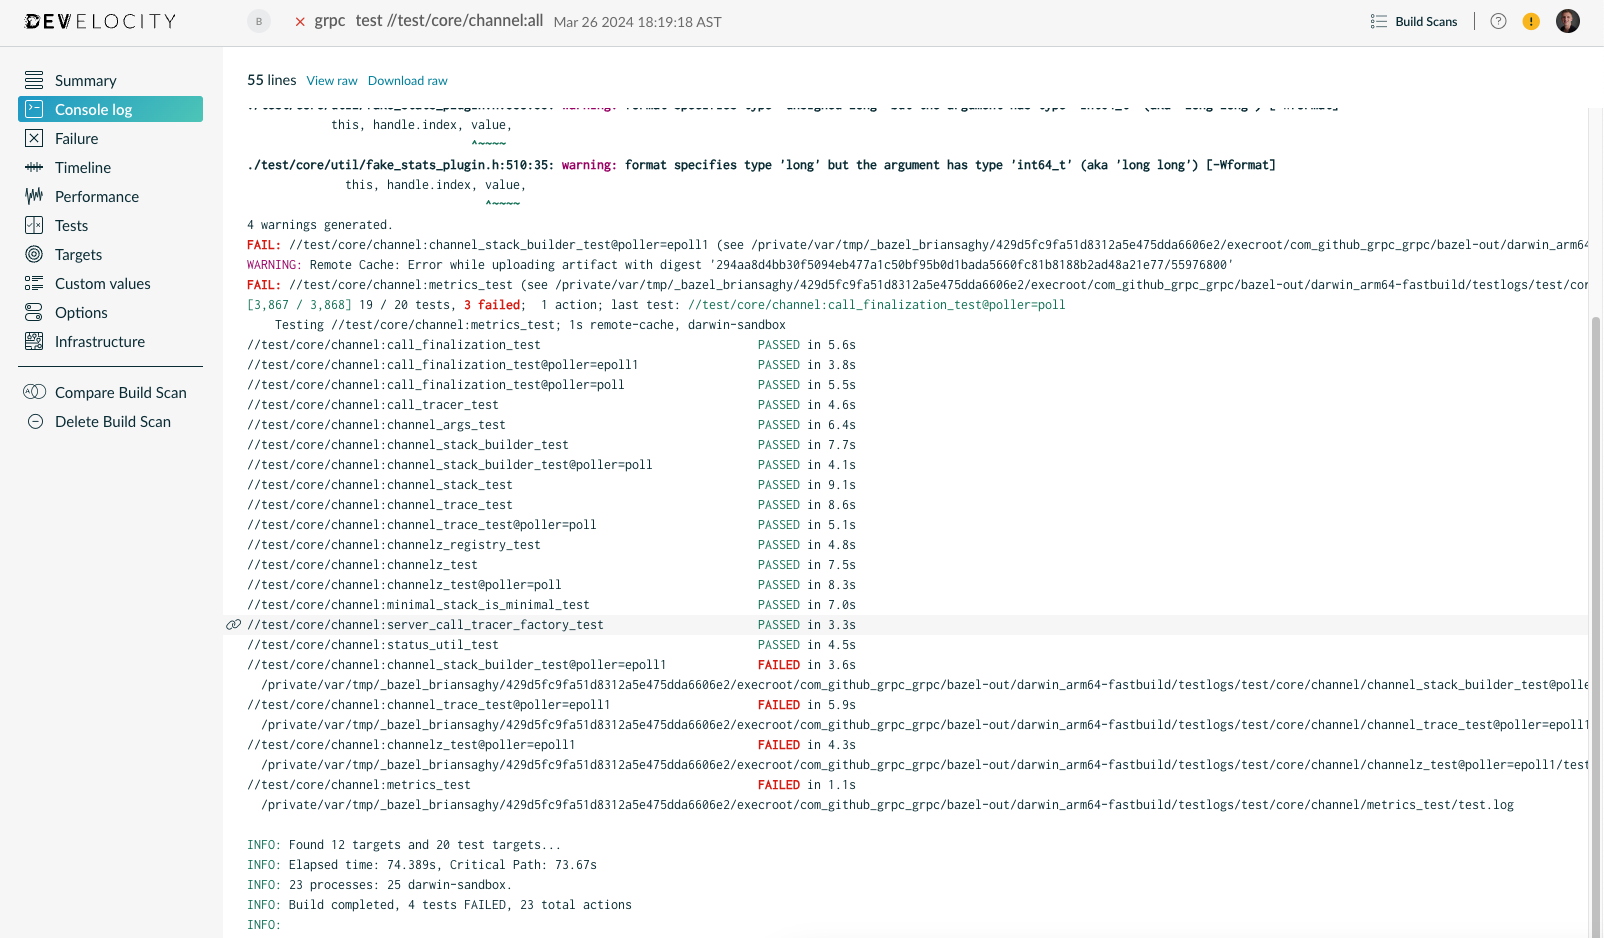
Select any line to highlight it, or shift-click two lines to highlight a block. The browser location updates to reflect the selection. Share that URL with a colleague to direct them to specific console output.
Inspect Test Results
If your build ran tests, their results are included in your Build Scan. Use the left navigation menu to visit the Tests view.
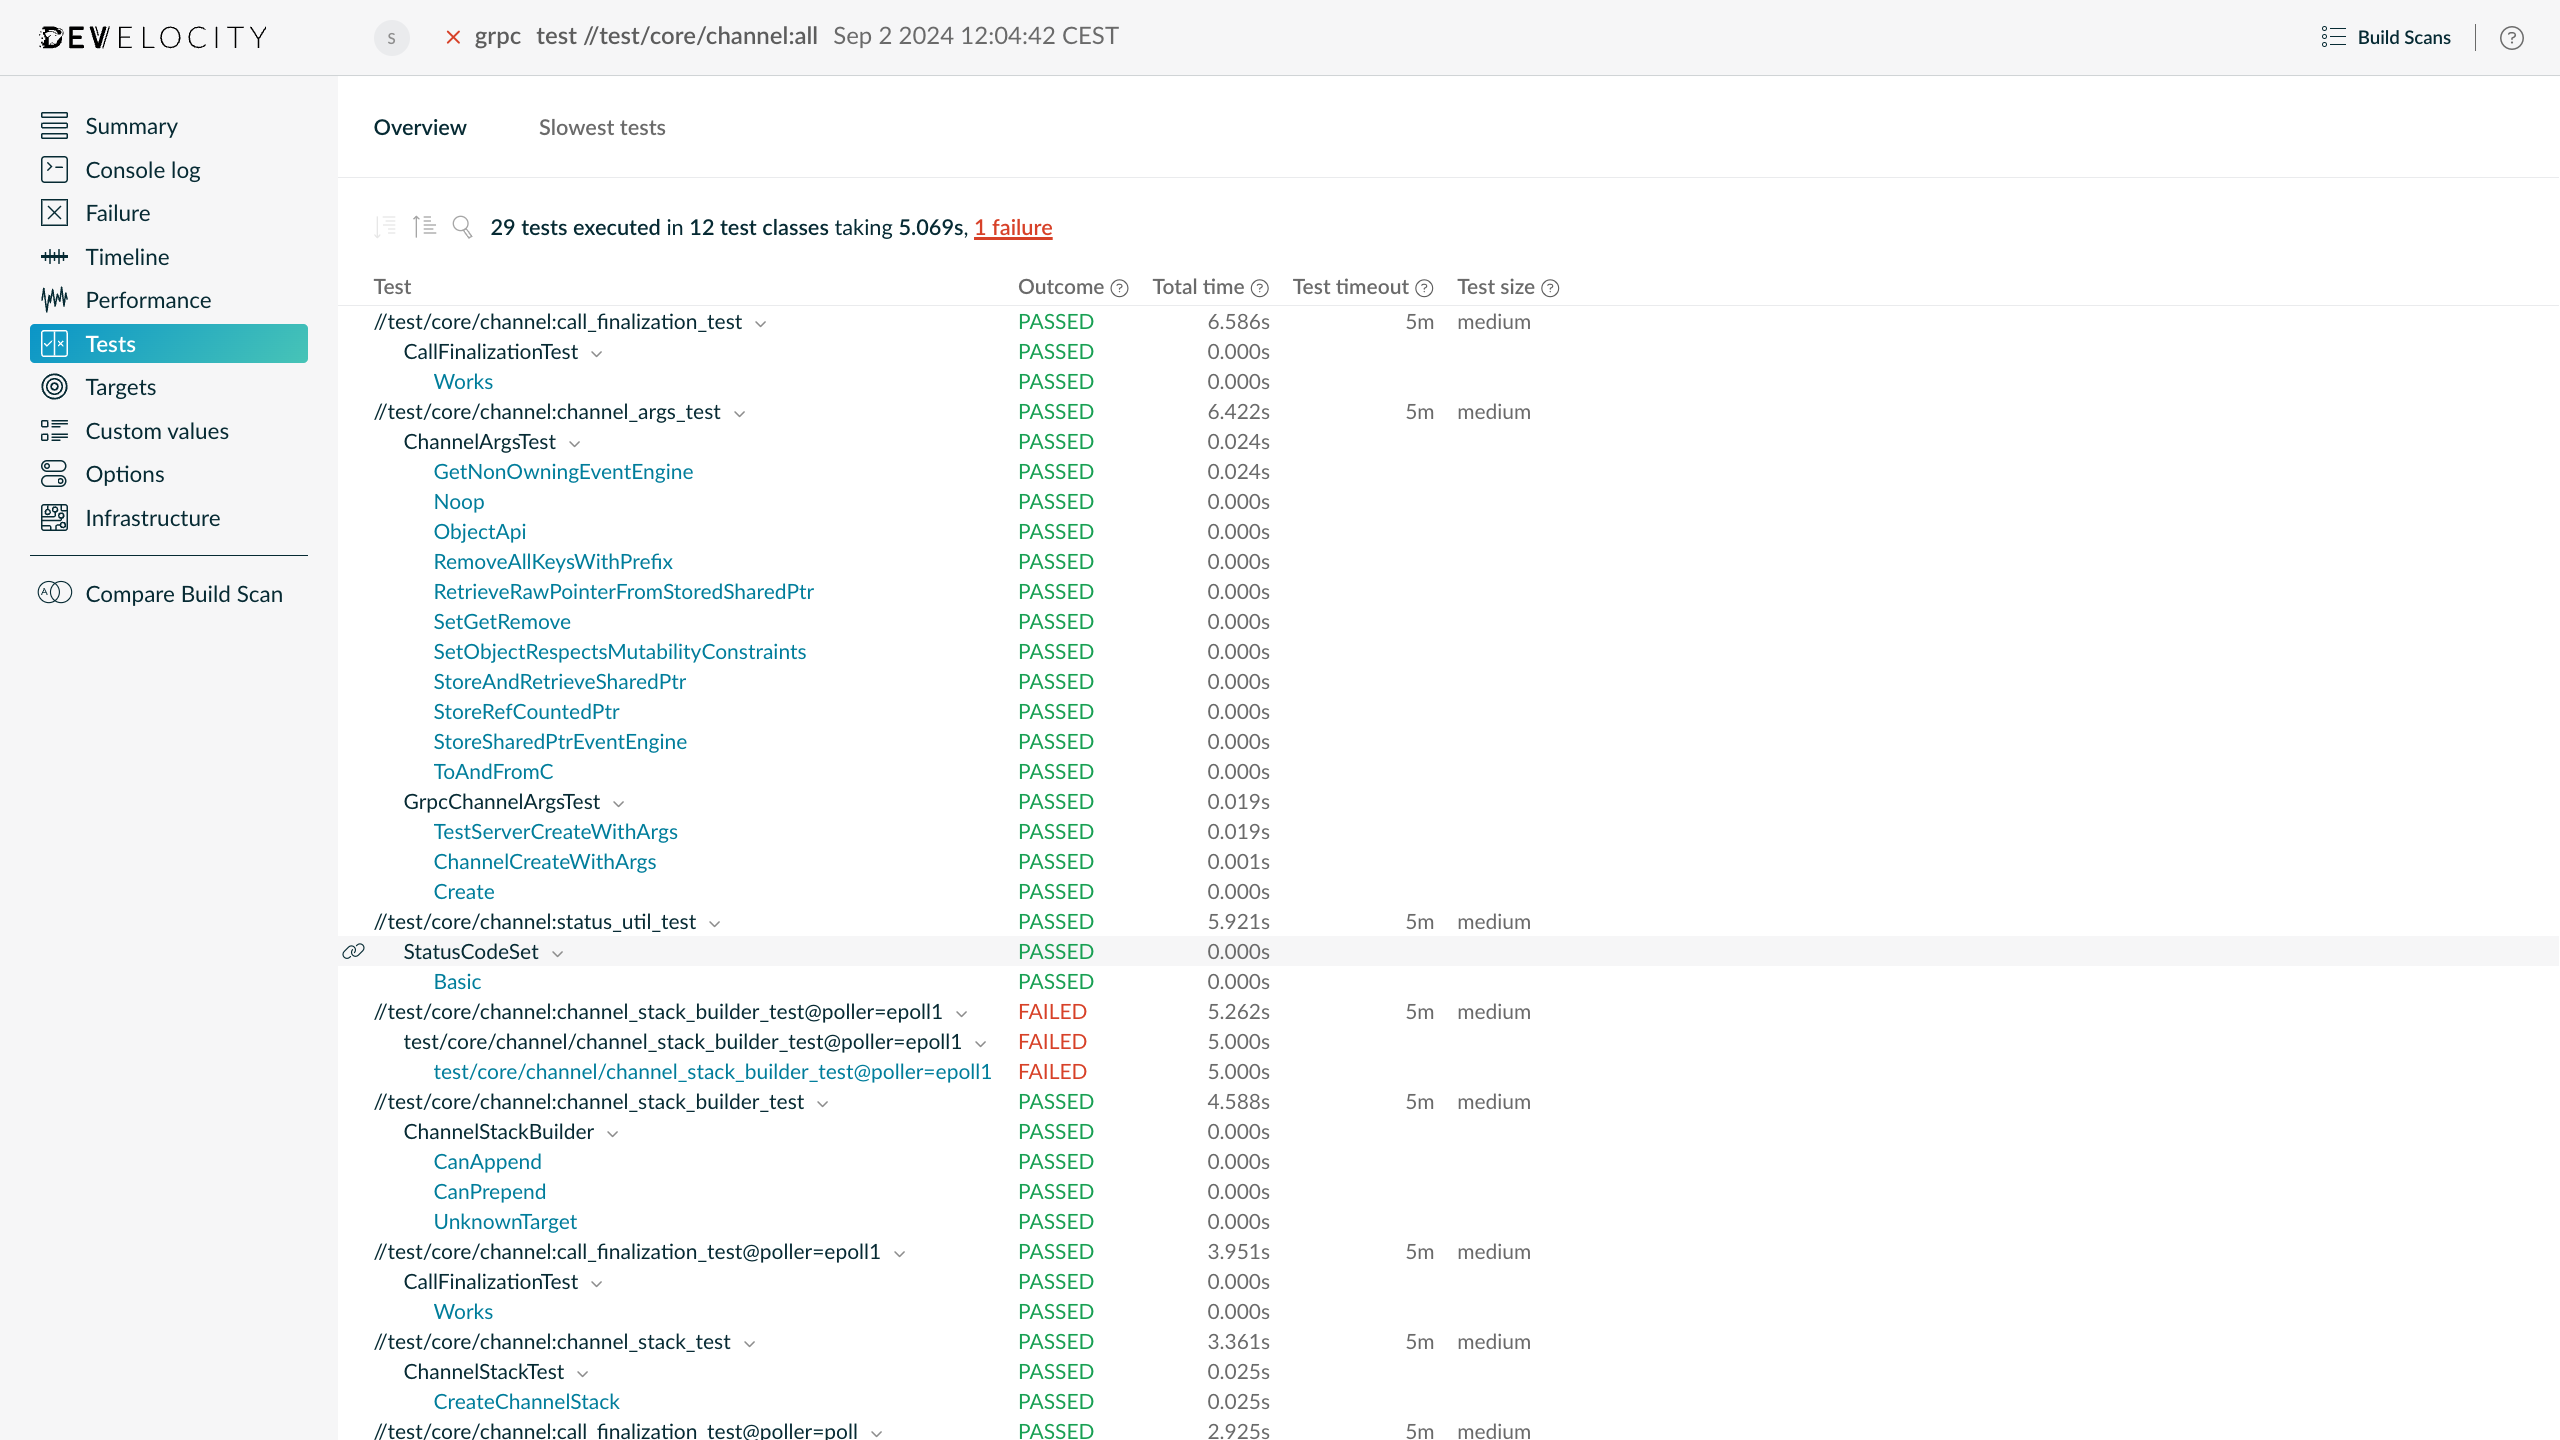
This section shows the results of all tests that ran during the build, along with their outcome, total time, test timeout, and test size. The total time generally corresponds to the wall clock time that an execution lasted. Results are broken down by target, test suite, and test case. Select any test case to see details about each of its individual executions, in case of test retry.
To see the slowest test cases, use the top navigation tab to visit the Slowest Tests view.
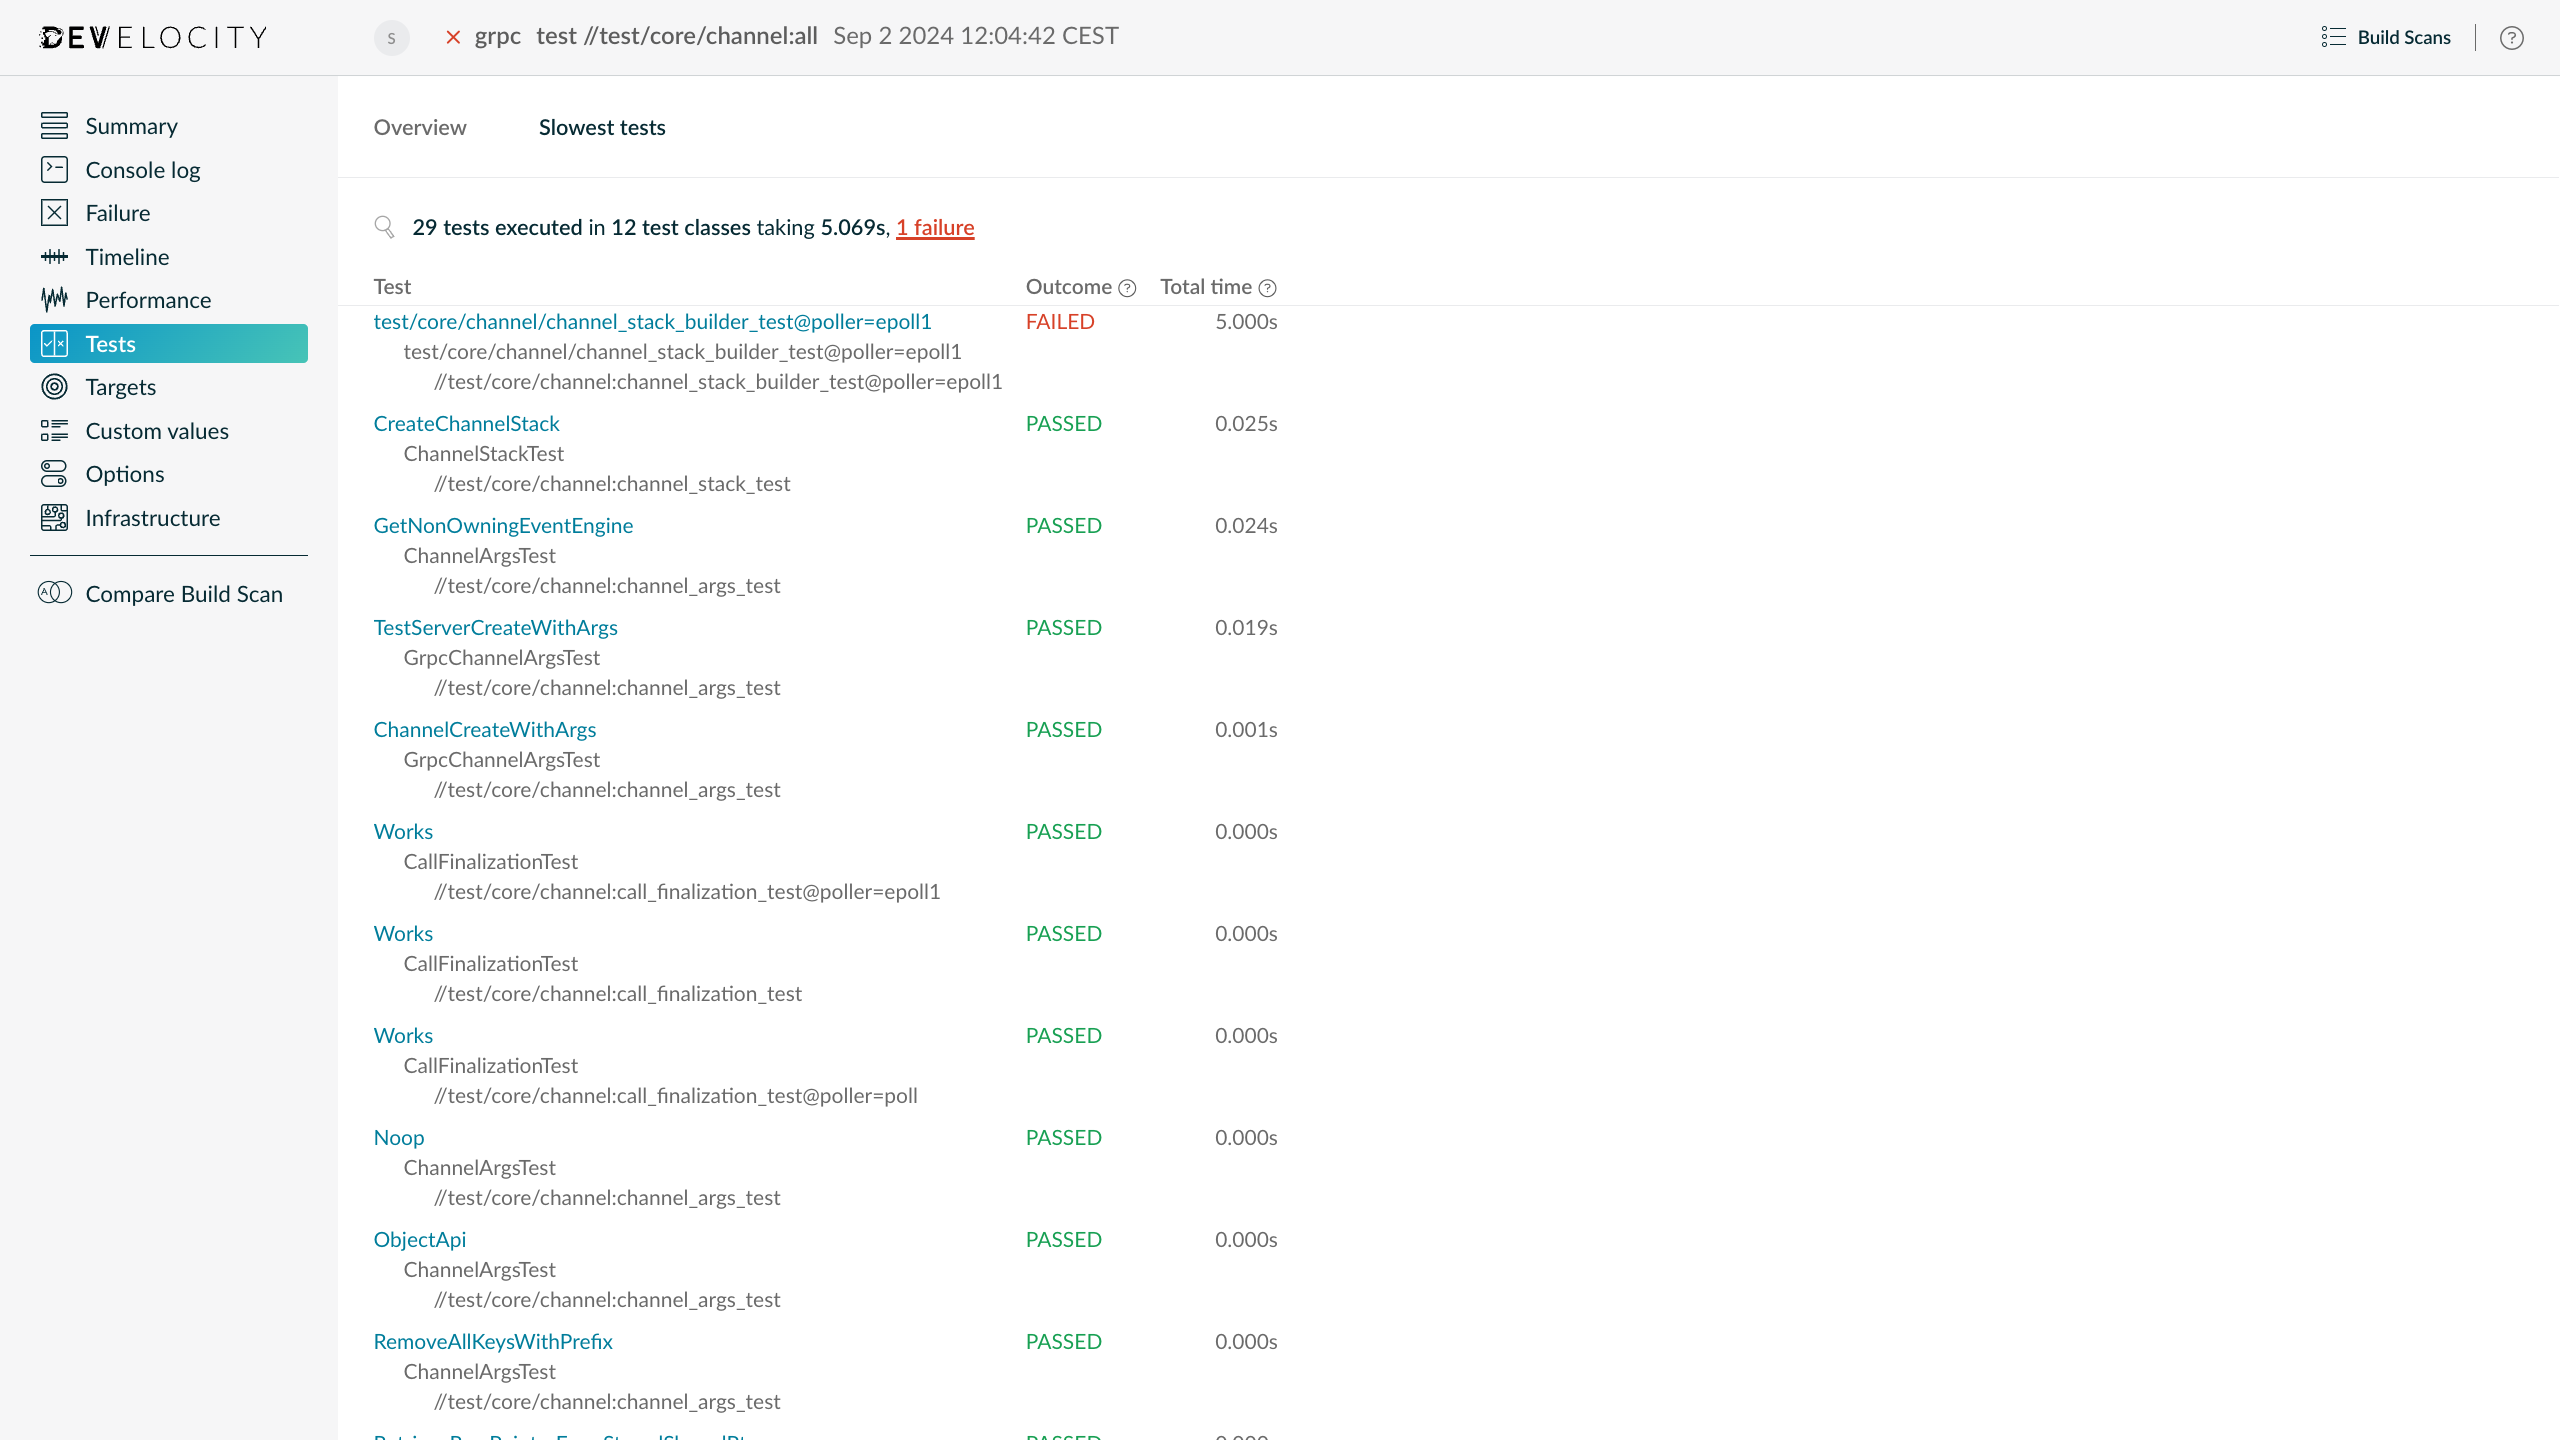
By default, Bazel test reporting is at a target-level granularity.
Bazel enables rules to override this behavior (for example, the built-in Java rules provide a detailed test report).
If you do not see test reporting at a test-case-level granularity, check that the Bazel rules you are using produce the required test.xml to override the default behavior.
See the Bazel documentation for more details.
|
Analyze Build Performance
Use the left navigation menu to visit the Timeline view.
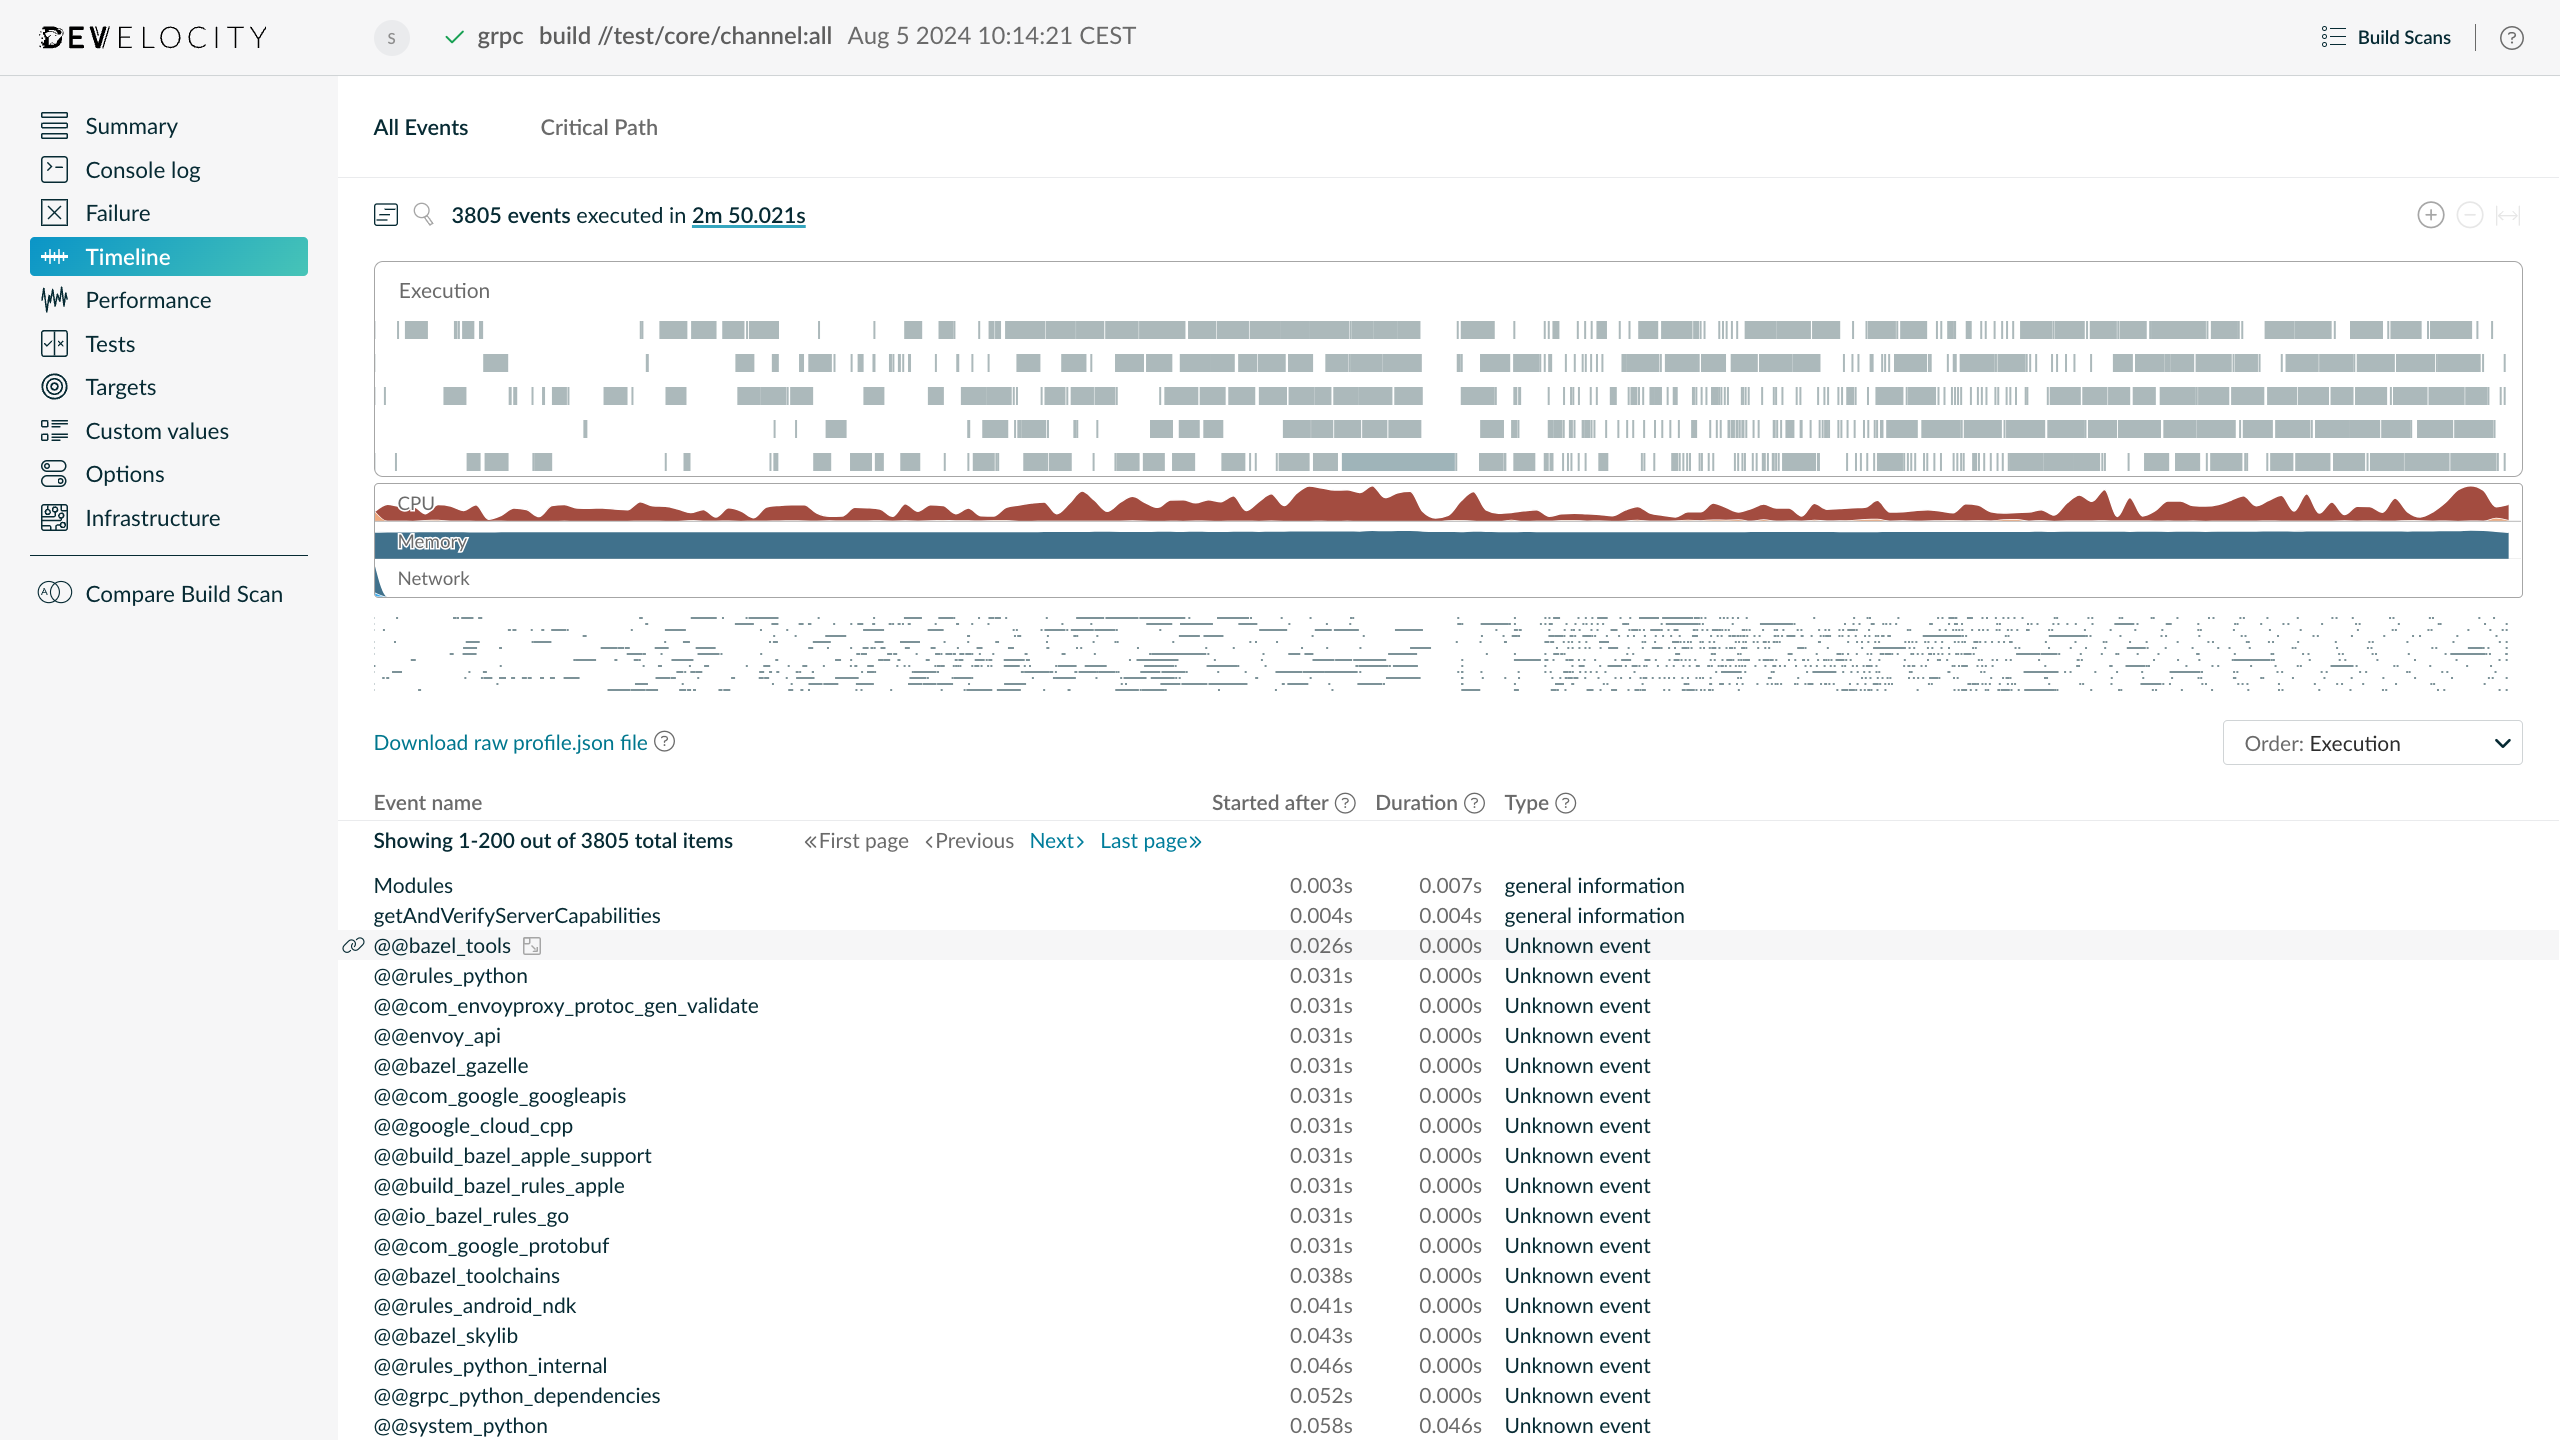
This view shows event executions as a timeline, alongside resource usage (CPU, memory, and network) for the Bazel process and the system as a whole.
The table below the graph provides a breakdown of events executed during the build.
Select the  icon when hovering over an event to see more detail and understand dependencies between events.
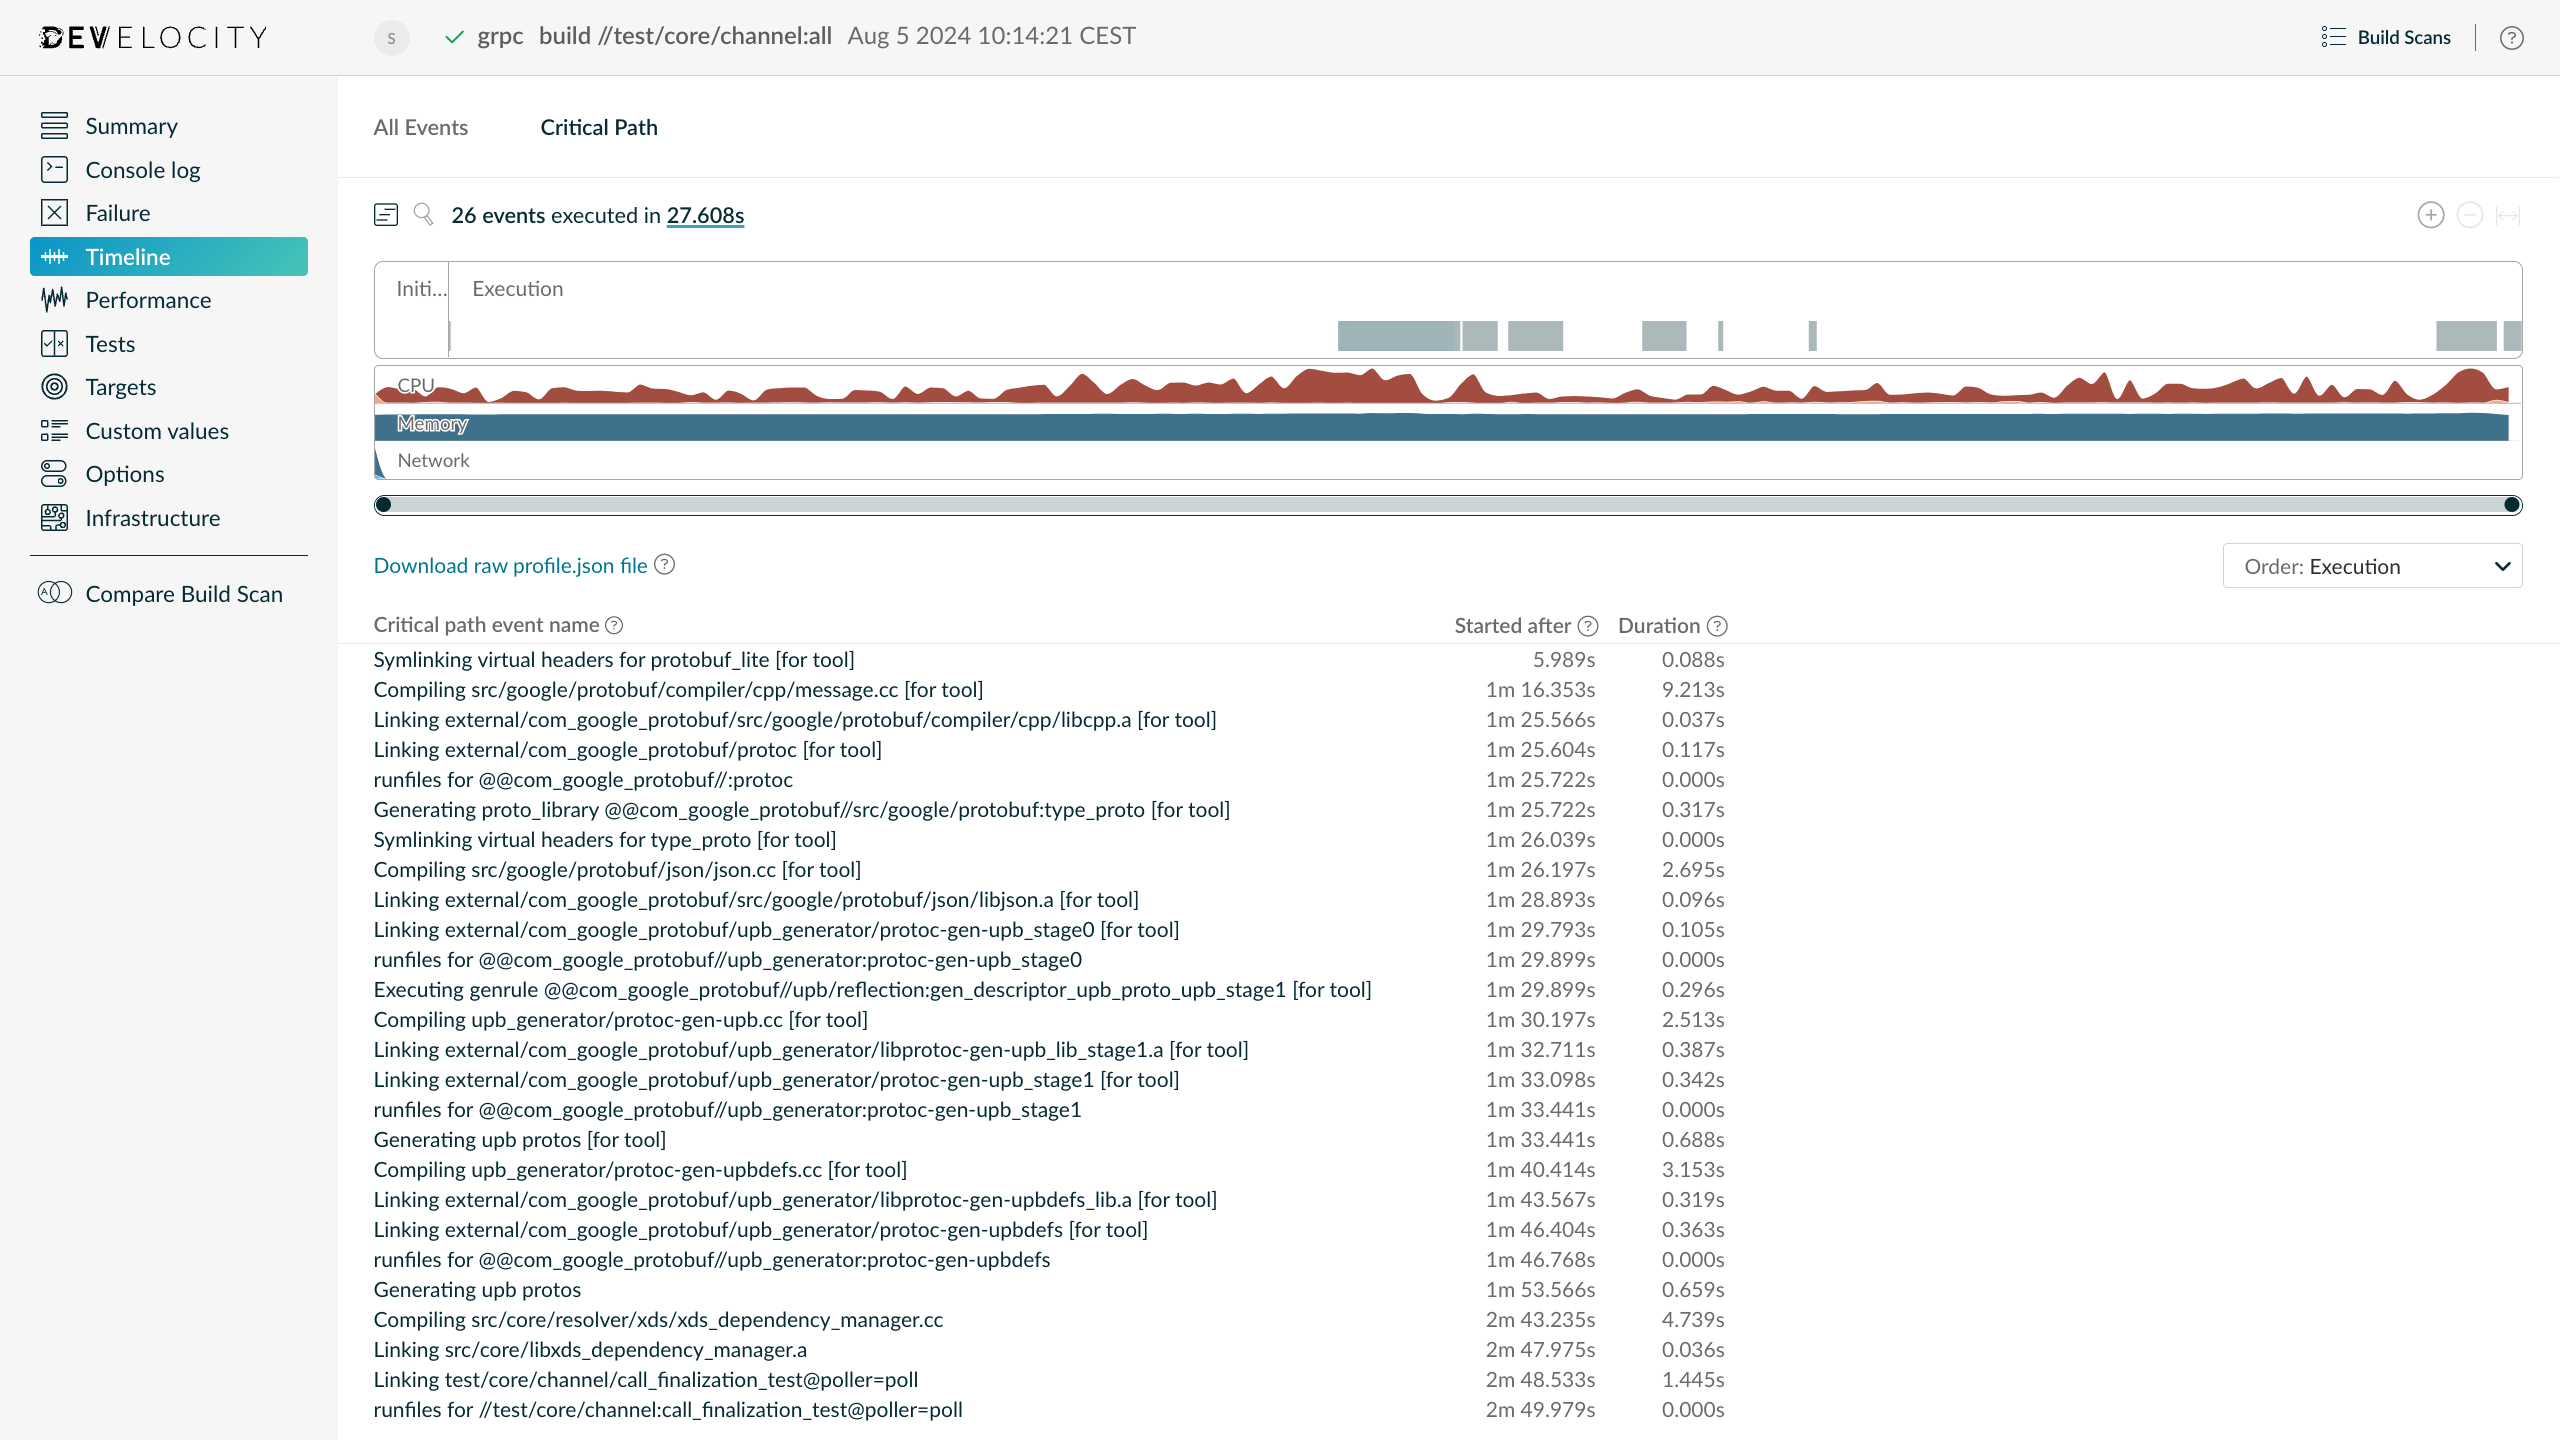
The Critical Path tab shows the longest chain of dependent actions. It estimates the shortest possible build time if all non-dependent actions were executed in parallel with infinite resources.
Custom Tags, Values, and Links
Enrich your Build Scan with metadata using several means. In particular:
-
VCS information such as commit identifiers and branch names
-
Tags for different types of builds (for example,
CIvs.local) -
Links to CI pipeline runs
This adds searchable context to your Build Scan.
Integrating With CI
Build Scan publication is passive with regard to the build process.
Enabling it does not affect the outputs of your build.
It is safe to add the necessary configuration to your project’s .bazelrc file and check it into version control, enabling Build Scan publication for all users of the build.
With Bazel, connectivity errors to Develocity may cause the Bazel command to return a non-zero exit code. If there is no connection when Bazel tries to publish to the Develocity Build Event Server, Bazel exits with code 38 and displays a message similar to the following:
INFO: Build completed successfully, 1 total action
ERROR: The Build Event Protocol upload failed: All 4 retry attempts failed. UNAVAILABLE: develocity.example.com UNAVAILABLE: develocity.example.com
At the time of this writing, the Bazel client does not offer a configuration option to fail gracefully in these instances.
Next Steps
-
Configure authentication: see Authenticating With Develocity in the Configuration Guide
-
Configure the remote cache: see Using a Bazel Remote Cache in the Configuration Guide
-
Set a project name for project-level access control: see Setting the Project Name in the Configuration Guide
-
Extend the Build Scan with custom tags and links: see Extending the Build Scan in the Configuration Guide
-
Stay informed about new Develocity releases and features: subscribe to the monthly Gradle newsletter